
There is a Core Web Vital that most Australian Shopify stores are quietly failing, and it is not the one your developer keeps talking about. Largest Contentful Paint gets all the attention because it is easy to measure and easy to brag about. Interaction to Next Paint is the one that actually decides whether your store feels fast when a customer taps “Add to cart”, opens a filter, or expands a variant picker on their phone. It became a stable Core Web Vital on 12 March 2024, replacing First Input Delay, and it has been a Google ranking signal ever since (web.dev).
Here is the uncomfortable part. A store can score 95 in Lighthouse on a fresh page load and still serve a sluggish, frustrating experience the moment a real customer starts interacting with it. We see it constantly in our audits: the lab score looks brilliant, the field data tells a different story, and conversion quietly leaks. This article is the build playbook we use at Insiteful to take a Shopify store’s INP from “needs improvement” into the sub-200ms “good” band, with the exact diagnostics, code patterns, and trade-offs we apply on real client builds.
What INP actually measures (and why your Lighthouse score lied to you)
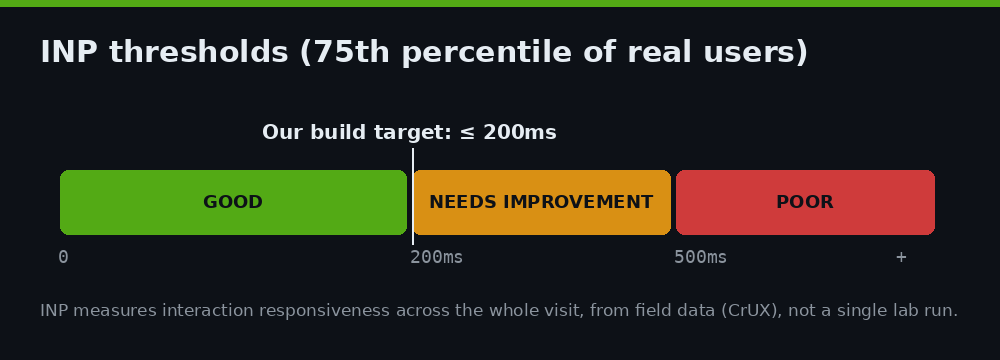
INP measures the latency of interactions across the entire lifetime of a page visit. Every time a customer taps, clicks, or presses a key, the browser records how long it takes from that input to the next frame being painted on screen. At the end of the visit, INP reports roughly the worst interaction (technically the high percentile of all interactions). A good INP is 200 milliseconds or less at the 75th percentile of real users; 200 to 500ms needs improvement; and anything above 500ms is poor (web.dev).
The critical word there is real users. INP is a field metric. You cannot get a true INP reading from a single Lighthouse run, because Lighthouse loads the page and never interacts with it the way a shopper does. The data Google actually uses for ranking comes from the Chrome User Experience Report (CrUX), which aggregates anonymised field data from real Chrome visitors. Shopify’s own performance team is explicit about this: you have to look at real-user data, not a lab tool run on page load (Performance @ Shopify).
That single distinction explains why so many stores think they are fine when they are not. The first thing we do on any performance engagement is stop trusting the green Lighthouse number and pull the field data. The script below is the lightweight Real User Monitoring snippet we drop into a theme to capture INP from actual visitors using Google’s official web-vitals library:
import {onINP} from 'https://unpkg.com/web-vitals@4?module';

onINP((metric) => {
  // metric.value is the INP in milliseconds
  // metric.attribution tells you WHICH element and event caused it
  const t = metric.attribution.interactionTarget;
  navigator.sendBeacon('/apps/rum-collect', JSON.stringify({
    metric: 'INP',
    value: metric.value,
    target: t,                      // e.g. "button.product-form__submit"
    eventType: metric.attribution.interactionType,
    inputDelay: metric.attribution.inputDelay,
    processingDuration: metric.attribution.processingDuration,
    presentationDelay: metric.attribution.presentationDelay,
    url: location.pathname
  }));
});
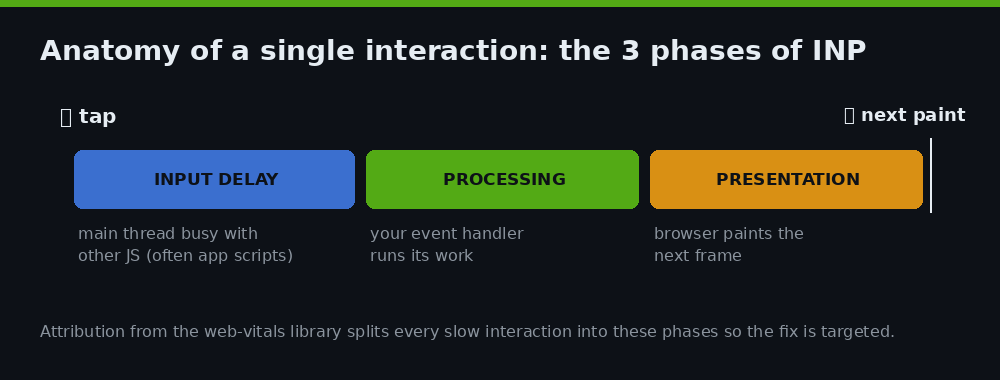
The attribution object is the gold. It does not just tell you that INP is 480ms; it tells you the offending element (the add-to-cart button, a collection filter) and breaks the delay into its three phases: input delay, processing duration, and presentation delay. That breakdown drives every fix decision we make below.
The real culprit on Shopify: app sprawl and a blocked main thread
When a Shopify store fails INP, the cause is almost never “Shopify is slow”. The platform’s edge and theme runtime are genuinely fast. The cause is JavaScript piled onto the main thread, and the largest single source of that JavaScript is third-party apps. Industry analysis in 2026 attributes 60 to 80 per cent of Shopify front-end slowdowns to app scripts rather than the platform itself, with the average store running 15 to 20 apps and 5 to 10 of those injecting front-end JavaScript on every page (DebugBear, Thunder Page Speed). Each app can ship anywhere from 100KB to 500KB of JavaScript that the browser must parse, compile, and execute on the same thread that is supposed to respond to taps.
The main thread is single-lane. When a 380ms script from a reviews app is executing, a customer’s tap on the variant selector simply waits in line. That wait is input delay, and input delay is the first component of INP. This is why we treat every installed app as a liability until proven otherwise. The build artefact we produce at this stage is a per-app performance budget, which forces a number against every script on the page:
| App / script source | Main-thread JS | Loads on | INP risk | Verdict |
|---|---|---|---|---|
| Reviews widget | 410 KB | Every page | High | Defer to interaction |
| Upsell / bundle app | 290 KB | Every page | High | Load on cart only |
| Back-in-stock | 120 KB | Every page | Medium | Load on PDP only |
| Chat / support widget | 340 KB | Every page | High | Facade + lazy init |
| Analytics / tag manager | 180 KB | Every page | Medium | Yield + idle dispatch |
A store with this profile is carrying well over a megabyte of mostly idle JavaScript onto a phone. The fixes that follow are how we claw the main thread back. If you want the broader speed context first, our guide to Core Web Vitals for Shopify in 2026 covers how INP sits alongside LCP and CLS, and the app-by-app teardown in our app audit case study shows the rationalisation method end to end.
Diagnosing INP on a real client store
Field data tells you that you have a problem and roughly where. To fix it you need to reproduce it locally and watch the main thread in real time. Our standard diagnostic is a PerformanceObserver that logs every long task (any task over 50ms, the threshold at which the main thread is considered blocked) so we can see exactly which interaction is being starved:
// Log every long task and the interaction it blocks
const observer = new PerformanceObserver((list) => {
  for (const entry of list.getEntries()) {
    if (entry.duration > 50) {
      console.warn(
        `Long task: ${Math.round(entry.duration)}ms`,
        entry.attribution?.[0]?.containerName || 'unknown source'
      );
    }
  }
});
observer.observe({type: 'longtask', buffered: true});
We run this in Chrome DevTools while clicking through the real interaction paths a customer uses: open a filter, change a variant, add to cart, open the mini-cart. Every warning that fires during one of those taps is a candidate for the fix list. We pair it with a performance trace recording so we can see the call stack inside each long task and trace it back to a specific theme function or app script. The output is a ranked list: which interaction, which script, how many milliseconds, and which of the three INP phases it lands in. That ranking is the difference between guessing and engineering, and it is the same discipline we describe in our site-speed diagnostic walkthrough.
Fix 1: Break up long tasks so the browser can breathe
The highest-leverage INP fix is also the least understood: stop running long, uninterrupted blocks of JavaScript. When your code, or an app’s code, runs a 300ms task without pausing, the browser cannot respond to any input until that task finishes. The solution is to yield to the main thread at sensible points so pending interactions can jump the queue.
The modern tool for this is scheduler.yield(), which pauses your task, lets the browser handle higher-priority work like a tap, and then resumes your task before other queued work runs. As of 2025 it is supported in Chrome and Firefox (Firefox shipped it in August 2025), but Safari has not implemented it, so a fallback is non-negotiable on a commerce store where a meaningful slice of Australian traffic is on iPhones (MDN). Here is the resilient yield helper we ship:
// Yields to the main thread; falls back gracefully on Safari
async function yieldToMain() {
  if ('scheduler' in window && 'yield' in scheduler) {
    return scheduler.yield();
  }
  // Fallback: a macrotask via setTimeout keeps Safari responsive
  return new Promise((resolve) => setTimeout(resolve, 0));
}

async function processHeavyWork(items) {
  for (const item of items) {
    renderItem(item);
    // Give the browser a chance to handle a pending tap
    if (navigator.scheduling?.isInputPending?.() || items.indexOf(item) % 10 === 0) {
      await yieldToMain();
    }
  }
}
On a recent build we applied this pattern to a collection page that rendered 60 product cards plus swatch logic in one synchronous loop. Breaking the loop with yields took the add-to-cart interaction during render from roughly 410ms down into the 180ms range. The work still happens; it just stops holding the customer’s tap hostage.
Fix 2: Tame third-party and app scripts
You cannot always rewrite an app’s JavaScript, but you can control when it runs. The default for most Shopify apps is to execute immediately on every page, which is the worst possible behaviour for INP. We apply three patterns, in order of preference.
Load on interaction. A chat widget, a reviews carousel, or a bundle builder does not need to exist until the customer signals intent. We replace the live widget with a lightweight static placeholder (a “facade”) and only load the real script on first interaction or when it scrolls into view:
// Load a heavy widget only when the user actually needs it
const trigger = document.querySelector('[data-reviews-facade]');
const loadReviews = () => {
  const s = document.createElement('script');
  s.src = 'https://reviews-app.example/widget.js';
  s.async = true;
  document.body.appendChild(s);
  trigger.removeEventListener('click', loadReviews);
};
trigger.addEventListener('click', loadReviews, {once: true});

// Or load when it scrolls near the viewport
new IntersectionObserver((entries, obs) => {
  if (entries[0].isIntersecting) { loadReviews(); obs.disconnect(); }
}, {rootMargin: '400px'}).observe(trigger);
Scope to the page that needs it. A back-in-stock script belongs on product pages, not the homepage. Shopify’s theme architecture lets us conditionally include app blocks per template, so we strip global injections back to where they earn their place. Push non-visual work to idle. Analytics events, tag manager pushes, and personalisation pixels do not need to block a tap; we dispatch them with requestIdleCallback so they run in the gaps between interactions rather than on top of them. This page-scoping discipline is core to the native-Shopify approach we describe in getting headless-level performance on native Shopify.
Fix 3: Make event handlers cheap and responsive
Once the browser starts processing an interaction, the efficiency of your event handler decides the processing-duration phase of INP. Two patterns do most of the heavy lifting here. The first is debouncing high-frequency events. A search-as-you-type field or a price-range slider can fire hundreds of times per second, and if each keystroke triggers a filter recalculation, the main thread never recovers:
function debounce(fn, wait = 150) {
  let timer;
  return (...args) => {
    clearTimeout(timer);
    timer = setTimeout(() => fn(...args), wait);
  };
}

// Predictive search: recalc only after typing pauses
searchInput.addEventListener('input', debounce((e) => {
  runPredictiveSearch(e.target.value);
}, 200));
The second is optimistic UI. When a customer taps “Add to cart”, do not make them wait for the network round-trip and the full cart re-render before anything visibly changes. Update the cart count and show the line item immediately from local state, then reconcile with the server response in the background. The interaction feels instant because the next paint happens within a frame, while the slower work continues out of the customer’s eyeline. The same logic applies to variant switching, quantity steppers, and wishlist toggles.
Fix 4: Paint feedback within 50 milliseconds
The final INP phase is presentation delay: the time from your handler finishing to the browser actually painting the result. Two rules govern this. First, render a visible response fast, even if the full result is not ready. A filtered collection that shows a skeleton grid within 50ms feels dramatically faster than one that shows nothing for 400ms and then snaps in, even when the total time is identical. Second, prefer CSS for animation. A drawer that slides open via a CSS transform transition runs on the compositor and stays smooth; the same drawer animated frame-by-frame in JavaScript competes for the main thread and stutters under load:
/* Compositor-friendly: does not block the main thread */
.cart-drawer {
  transform: translateX(100%);
  transition: transform 0.25s ease-out;
  will-change: transform;
}
.cart-drawer.is-open { transform: translateX(0); }
It is a small change with an outsized effect on perceived responsiveness, and it costs nothing in app fees or platform complexity.
Measuring the win the right way
Because INP is a field metric, you do not declare victory in DevTools; you declare it in the field data over the following weeks. We keep the RUM beacon from the first section running in production and watch the 75th-percentile INP trend, segmented by device and by template, because the mobile and desktop gap is enormous. Across the web, around 97 per cent of desktop pages hit good INP while only 77 per cent of mobile pages do, and among the most-trafficked sites only about 53 per cent pass on mobile (corewebvitals.io). For a store where the majority of Australian traffic shops on a phone, mobile INP is the number that moves revenue, so that is the segment we hold ourselves to.
| Interaction | Before (p75) | After (p75) | Primary fix |
|---|---|---|---|
| Add to cart (PDP) | 410 ms | 180 ms | Yield + optimistic UI |
| Collection filter | 520 ms | 190 ms | Debounce + skeleton |
| Open mini-cart | 360 ms | 140 ms | CSS transition + facade |
| Variant switch | 280 ms | 120 ms | Optimistic UI |
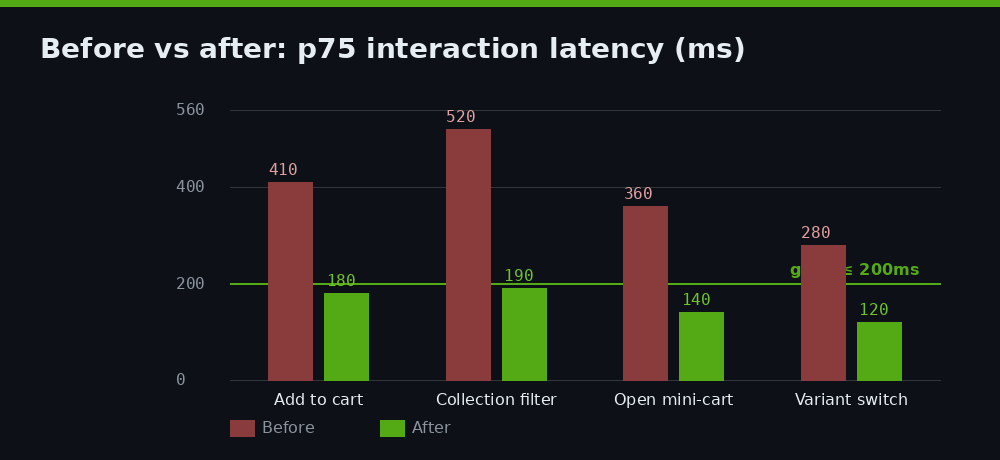
Those are representative figures from the patterns above, and the shape is consistent: the worst offenders are interactions that combined a heavy synchronous task with a slow visual response, and fixing both phases at once is what drops them under 200ms.
How we do it at Insiteful
When a brand comes to us with a responsiveness problem, we do not start by installing a “speed booster” app, because that is usually one more script on the very thread we are trying to clear. We start with field data. We pull the store’s CrUX history and stand up real-user monitoring so we are optimising against what actual Australian shoppers experience, not a synthetic lab score. From there we run the long-task diagnostic, build the per-app performance budget, and produce a ranked fix list where every item has a millisecond figure and a named cause.
Then we engineer, in the order this article lays out: break up long tasks, control when third-party scripts run, make event handlers cheap, and guarantee fast visual feedback. Every change is measured against field data over the following weeks, not signed off on a single Lighthouse run. We do this work on native Shopify and Shopify Plus, without rebuilding the store headless, because the overwhelming majority of INP problems are JavaScript discipline problems, not platform problems.
A focused INP and Core Web Vitals engagement of this kind typically sits in the $8,500 to $18,000 AUD range depending on app sprawl and theme complexity, and it usually pays for itself through the conversion lift that comes with a store that finally feels instant on a phone. It is the same engineering rigour we bring to every build, whether that is a performance retrofit or a ground-up Shopify Plus project.
Get a build-grade INP assessment
If your store scores well in Lighthouse but feels sluggish the moment customers start tapping, your INP is almost certainly the gap between the two. We will pull your field data, find the interactions that are costing you conversions, and give you a prioritised, costed plan to get them under 200ms. Book a build assessment with Insiteful and we will show you exactly where your main thread is bleeding and what it takes to fix it.