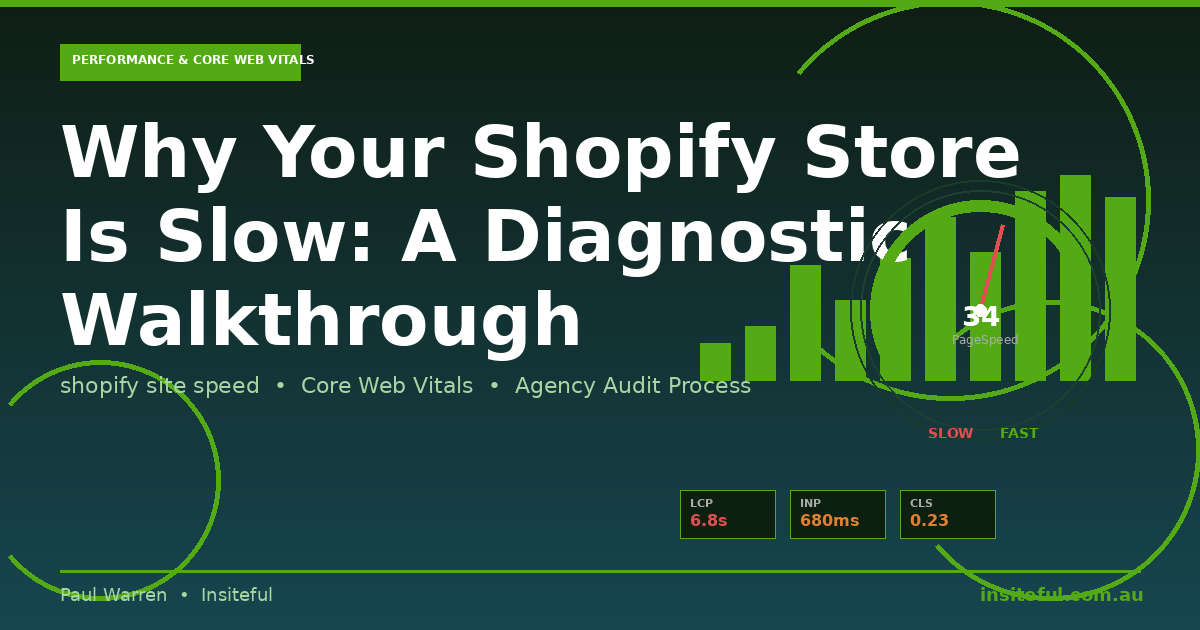
Your Lighthouse score says 34. You’ve run it three more times hoping it changes. It doesn’t.
The frustrating part isn’t the number itself. It’s that Lighthouse hands you a list of 18 “opportunities” and you have no idea which ones will actually move the needle, which ones are caused by apps you can’t remove, and which ones are the reason you’re losing roughly 20% of your mobile visitors before the page finishes loading.
We run performance audits on Shopify stores regularly at Insiteful. What we find consistently is that most stores aren’t slow because of one catastrophic problem. They’re slow because of a dozen small decisions that compound over time: the review app installed in 2022, the live chat widget that loads on every page including the checkout, the hero image sitting at 4.2MB because nobody set an image compression standard. This walkthrough covers exactly how we diagnose these stores, step by step, in the order we actually do it.
What “Slow” Actually Means in 2026
The metric that matters most for a Shopify store right now is not your overall Lighthouse score. It’s LCP: Largest Contentful Paint, meaning how long it takes for the biggest visible element on the page (almost always your hero image or a product image) to appear on screen.
Google’s threshold is 2.5 seconds. Below that, you’re in the “good” zone. Between 2.5 and 4 seconds is “needs improvement”. Above 4 seconds is “poor”. These thresholds feed directly into your Page Experience signal and influence where you rank in search results.
The second metric that has caught many Shopify stores off guard since Google replaced FID with INP in March 2024 is Interaction to Next Paint. INP measures how quickly your store responds after someone taps a button, opens a product image, or interacts with any page element. The threshold is 200 milliseconds. In a 2026 benchmark study across the top 1 million sites, 43% still fail the INP threshold. For Shopify stores with multiple third-party apps running JavaScript on every page, it’s often worse.
CLS (Cumulative Layout Shift) rounds out the three Core Web Vitals. It measures whether your page shifts visually as it loads, the experience where you go to tap a button and it suddenly jumps out of reach. The threshold is under 0.1. The main culprits on Shopify are images without defined dimensions, app-injected announcement bars that load after the initial render, and web fonts that swap in late and reflow the text around them.
Only 47% of sites globally meet Google’s “good” threshold across all three metrics. Sites that do pass all three show an average 24% lower bounce rate compared to those that don’t. For Shopify stores investing in paid traffic, that gap directly affects your cost per acquisition.

The Lighthouse Trap
Lighthouse is the obvious starting point, and it misleads more store owners than it helps.
The score it generates, the number between 0 and 100, is a composite that weights different audits and is run against a simulated mid-range Android device on a 4G connection. That simulation is intentional: Google wants to benchmark against a realistic mobile experience for the global web. But it means the score can swing 10 to 20 points between runs depending on your server response time at that moment, CDN load, and the network simulation variance built into the tool. We’ve run Lighthouse on the same page three minutes apart and seen a 17-point difference.
So stop chasing the score. Run it once on mobile for a baseline, then focus on three things that actually tell you what to fix:
- The LCP element and its load path. What is the largest contentful element? Is it an image? Is that image being loaded from Shopify’s CDN with the right dimensions and a modern format like WebP? Is it being preloaded? These three questions determine your LCP more than anything else.
- The “Eliminate render-blocking resources” audit. This is where you’ll typically find 8 to 14 app scripts loading synchronously in the <head>. Each one forces the browser to stop rendering, download the script, and execute it before it draws a single pixel on screen.
- The “Reduce unused JavaScript” audit. Shopify stores commonly load 1.5 to 2.5MB of JavaScript per page. A significant portion of that is app code running on pages where the app doesn’t appear at all.
Lighthouse gives you a direction. WebPageTest gives you the detail you actually need to act.
Step-by-Step Audit on a Real Store
Earlier this year we audited a Shopify store doing around $180,000 a month in revenue. Fashion brand, strong organic traffic, 68% of sessions on mobile. Their Lighthouse mobile score was 31. Their mobile conversion rate was 1.2% against a desktop rate of 3.1%, which is an unusually wide gap and a strong signal that mobile performance was actively costing them sales.
Here is exactly how we ran the audit.
Phase 1: Lighthouse baseline (30 minutes)
We ran Lighthouse on the homepage, a collection page, and a product page. Not just the homepage in isolation. All three, because the performance profile of a product detail page is often very different to the homepage. The PDP had a Lighthouse score of 24. The product hero image was loading at 5.2MB, unoptimised, directly from the original photographer upload. LCP was 6.8 seconds on a simulated mobile connection.
Phase 2: WebPageTest waterfall (45 minutes)
Running the same PDP through WebPageTest on a Moto G4 profile at “Cable” connection speed revealed the full picture. 214 requests. 8.7MB total page weight. The waterfall showed four synchronous scripts loading in the <head> before a single pixel rendered: a review app bundle, a loyalty widget, a live chat script, and a custom tracking pixel hardcoded by the previous developer. Combined blocking time for these four scripts before first render: 2.9 seconds.
The waterfall also showed the hero image loading at request position 47. By the time the browser reached it in the download queue, 3.1 seconds had already elapsed.

Phase 3: App audit (1 hour)
We exported the full installed app list from the Shopify admin. There were 31 apps. We cross-referenced each one against its actual frontend footprint using the network tab in Chrome DevTools. Nine apps had no visible storefront output at all: admin reporting tools, a CSV importer, an inventory sync tool for a warehouse integration, and a defunct loyalty programme that was set up but never launched. All nine were still injecting scripts into every page load.
The remaining 22 apps included seven with active frontend widgets. Of those seven, three were loading their full JavaScript bundle on every page type, including the homepage and collection pages where their widgets were not displayed.
Phase 4: Theme code audit (1.5 hours)
We pulled the theme code and searched for render-blocking script and link tags without async or defer attributes. There were six. Two were from the original theme’s base code, and four were added by a developer during a previous speed optimisation engagement. The irony was not lost on the client.
We also found the core of the LCP problem in the hero image loading path. The theme was using a simple src attribute pointing to the full-resolution image, with no srcset and no fetchpriority. Mobile browsers were downloading a 2400px wide image to display on a 390px screen.
Adding a srcset with appropriately sized Shopify CDN variants (360w, 720w, 1200w) and setting fetchpriority=”high” dropped the LCP from 6.8 seconds to 2.4 seconds. That’s one targeted change to two lines of Liquid code.
The 5 Most Common Shopify Speed Killers We Find
Across every performance audit we’ve run, five problems appear in almost every store.
1. Unoptimised hero images
The hero image is almost always the LCP element. It’s also the one most commonly uploaded at maximum resolution by a photographer who didn’t know Shopify would serve it at that size. A 4MB hero at 3000px wide adds 3 to 5 seconds to LCP on a mobile connection. The fix: use Shopify’s built-in image CDN with srcset so the browser requests an appropriately-sized version, and set fetchpriority=”high” on the hero img tag so the browser prioritises it above other downloads in the queue.
2. Review apps loading full bundles everywhere
Okendo, Judge.me, Yotpo, and Loox are the most common review platforms we see on Australian Shopify stores. All of them load their own JavaScript bundle, and if photo reviews are enabled, a secondary image gallery script on top. Yotpo’s full widget loads approximately 380KB of JavaScript per page. Loox runs between 200 and 400KB depending on configuration. If your product page LCP is over 4 seconds and you have a photo review app installed, start there. The fix is restricting the app’s script injection to product page templates only, which every major review app supports via their theme configuration settings.
3. Synchronous third-party tracking scripts
Klaviyo’s onsite tracking, Facebook Pixel, TikTok Pixel, Google Ads conversion tags, heatmap tools like Hotjar or Lucky Orange: all commonly injected synchronously in theme.liquid. Each one tells the browser to stop and wait before rendering. Moving them to load with defer or routing them through Google Tag Manager with async loading typically saves 0.8 to 1.6 seconds on Time to Interactive. We find at least two or three of these in every store, often placed there by marketing team members following the app’s default installation instructions.
4. Installed-but-inactive apps still injecting code
This is the one that surprises store owners most. A Shopify app that is installed but not actively displaying anything on the storefront still injects its JavaScript into every page load, unless you have explicitly removed it from the theme code. We regularly find 5 to 12 inactive or legacy apps contributing to page weight. Uninstalling the app through the Shopify admin is not enough. You need to check theme.liquid and any section files for orphaned script and stylesheet tags after removing an app, then manually delete them.
5. Render-blocking web fonts
Google Fonts loaded via a link tag in the head without display:swap are one of the most overlooked speed issues on Shopify themes. A typical Google Fonts request adds 400 to 600ms to render time. If the font doesn’t include font-display: swap, the browser holds the entire page render while it waits for the font to download. On a congested mobile connection, this is the difference between a 2.8-second page and a 3.5-second page. The fix: add display=swap to your Google Fonts URL and use rel=”preconnect” on the fonts.googleapis.com domain to reduce connection overhead.

How We Run a Speed Audit at Insiteful (the 3-Day Process)
When a store comes to us for a performance audit, we run it across three days. Not because it takes that long, but because we validate every fix before moving to the next one. Speed work is easy to break when you’re bundling changes.
Day 1: Baseline and discovery
We establish Lighthouse scores across four template types: homepage, collection page, product page, and cart. We run WebPageTest on all four using real device profiles, typically a Moto G4 for the low end and an iPhone 15 for the high end, because the gap between them often tells you whether the store’s issues are network-bound or CPU-bound. We audit the full app list and cross-reference every app against its actual storefront footprint using Chrome DevTools network analysis. By end of day one, we have a ranked list of issues by impact. Not by Lighthouse priority score. Those two orderings are often different.
Day 2: High-impact fixes
We work through the top five issues identified on day one. Typically: hero image srcset implementation, script deferral for non-critical app code, removal of inactive app remnants from theme.liquid, web font loading optimisation, and where applicable, lazy loading for below-fold images. We rerun Lighthouse and WebPageTest after each individual change. We never bundle multiple fixes into a single deployment, because if something breaks or causes an unexpected regression, we need to know exactly which change caused it.
On the fashion store referenced above, the day two changes alone took the mobile Lighthouse score from 31 to 58. LCP went from 6.8 seconds to 2.4 seconds. That’s a 27-point improvement from image optimisation, script deferral, and removing four inactive apps. No new infrastructure, no CDN migration, no theme rebuild.
Day 3: Secondary fixes and documentation
Day three covers the secondary issues: CLS fixes (usually setting explicit width and height attributes on images and replacing app-injected announcement bars with native theme blocks), INP work (identifying and deferring heavy JavaScript event listeners that slow down tap interactions on mobile), and any deeper theme-level code changes that require more careful testing before deployment.
We also produce a full audit report the client’s team can use to maintain performance standards going forward. The report covers which apps are safe to add in the future without impacting performance, which image upload standards the team should follow, and which third-party scripts need ongoing governance. A Shopify store that is fast today will be slow again in 12 months if nobody is tracking what gets added to it.
Performance Is a Trade-Off You Need to Manage Actively
The through-line in every performance audit we run is this: Shopify store speed is not a one-time fix. It’s an ongoing trade-off between the functionality you want (apps, widgets, tracking pixels) and the performance you need to convert the traffic you’re already paying for.
The stores we see with consistently strong Core Web Vitals share three habits. They audit their app stack at least quarterly and remove anything they’re not actively using. They have image upload standards their team follows. And they treat every new app installation as a performance decision, not just a feature decision.
If your store is loading slowly on mobile and you’re not sure where the problem is, a systematic audit will show you exactly which 3 to 5 changes will move the needle. In most cases, the biggest wins come from things that cost nothing to fix: image sizing, deferred scripts, and removing code that nobody knew was still running.
If you want us to run that diagnostic on your store, that is exactly what our speed audit covers. Book a free speed audit with the Insiteful team and we’ll walk you through exactly what is slowing your store down and what to do about it.