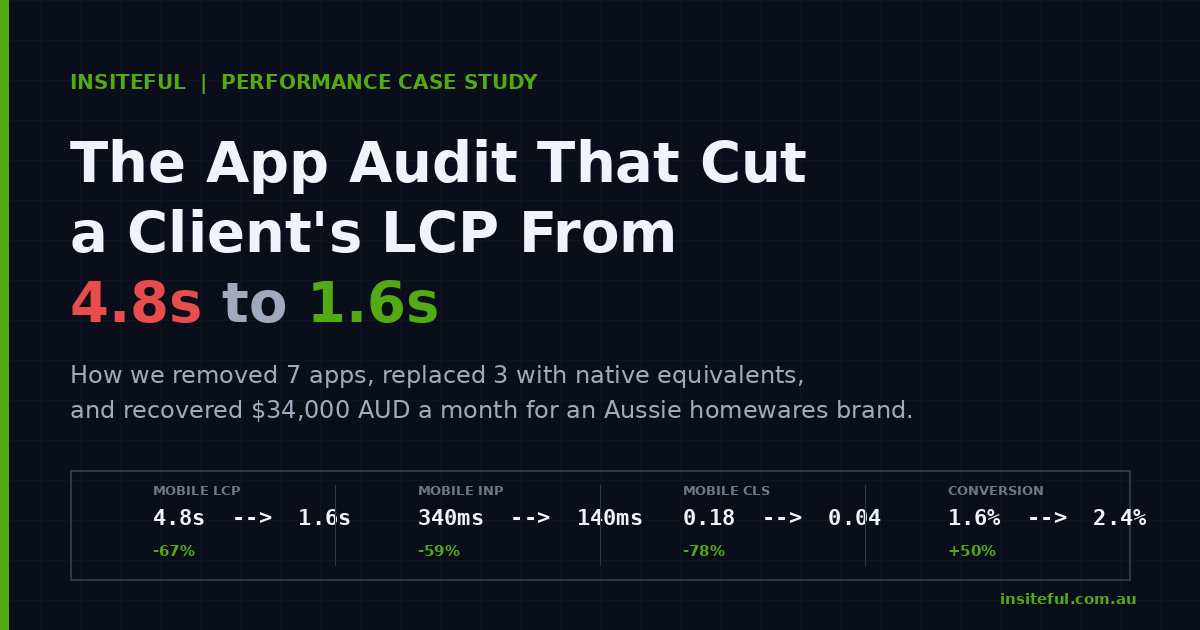
The homepage took 4.8 seconds to paint its hero image on a Telstra 4G connection in Brisbane. The mobile add-to-cart rate sat at 1.6 per cent. The brand was a homewares label doing roughly $120,000 AUD a month through Shopify, mostly off Meta and Google paid traffic, and the founder could not understand why a freshly redesigned store was converting worse than the version it replaced.
The new theme was beautiful. The product photography was stronger. The category architecture was cleaner. None of that mattered, because the page was not finishing rendering before a sizeable chunk of paid traffic had already tapped back to Instagram. We ran a full Shopify app audit, removed seven apps, replaced three with native equivalents, and reconfigured how the remaining stack loaded. Largest Contentful Paint dropped from 4.8 seconds to 1.6 seconds at the 75th percentile of mobile sessions, mobile conversion lifted from 1.6 per cent to 2.4 per cent, and the brand recovered roughly $34,000 AUD a month in revenue inside the first ninety days.
This article is the full walkthrough. The diagnostic process, the apps we removed, the technical fixes we applied, and the framework we now run on every Shopify Plus engagement at Insiteful.
Why an app audit is the highest-impact technical project on Shopify in 2026
Two numbers from the wider Shopify ecosystem set the context. The average Shopify merchant has six apps installed, but the cohort doing real volume usually carries fifteen to twenty, with some catalogues running thirty or more. Eighty-seven per cent of merchants use apps in some form, and the App Store now hosts more than 17,600 of them. The average app subscription sits at $58.49 a month, which means a store with a heavier stack is spending $1,200 AUD a month or more on apps before anyone has audited whether each one is earning its keep.
The Largest Contentful Paint problem follows directly from that. Stores with eight or more third-party app scripts show a median mobile LCP above 3.0 seconds. Stores with three or fewer scripts hold a median under 2.0 seconds. The median mobile LCP across the web sits at 2.26 seconds according to the 2025 Web Almanac, which is dangerously close to the 2.5 second Core Web Vitals threshold Google uses to grade a page as Good. One unoptimised hero, one extra app, and a passing store falls into the Needs Improvement bucket overnight.
The structural problem is that most stores accumulate apps the way kitchens accumulate utensils. Someone trials a quiz app for a campaign, leaves it installed. A previous agency adds a reviews app, then a different reviews app, then forgets to deactivate the first. A founder pastes a tracking pixel into Additional Scripts, then never returns. Every one of those decisions adds JavaScript to the homepage. None of them get reviewed unless someone pulls the inventory and runs an audit.
What the audit actually measures
An app audit is not a vibe check on the App Store reviews. It is a measurement exercise with five inputs we collect before anyone makes a removal decision.
The first input is the script tag inventory. Every app injects code into the storefront through one of three mechanisms: legacy ScriptTag API calls, Theme App Extensions with app embed blocks, or pixels firing through the Customer Events API. We export the full list with a Chrome DevTools Network panel filtered to the storefront origin, grouped by initiator script. Anything blocking the main thread before LCP becomes a candidate for elimination or deferral.
The second input is the field data. We pull the store’s Web Performance dashboard from the Shopify admin and check the LCP, INP, and CLS scores at the 75th percentile, broken out by template type. Home pages and product pages get audited separately because the dominant LCP element is different on each. The dashboard pulls from the Chrome User Experience Report (CrUX), so the numbers reflect real users on real devices, not a lab test from a server in Iowa.
The third input is the financial picture. We list every app, the monthly fee in AUD, the feature it provides, and the date it was installed. Roughly a third of the apps we find in any audit cost more than they earn, but no one has been measuring.
The fourth input is the merchant workflow audit. We ask the team which apps they actually open weekly. Apps that sit in the admin but never get logged into are either running unsupervised or aren’t earning the seat.
The fifth input is the dependency map. Some apps overlap (two review apps, two upsell apps, a quiz that does what a custom landing page would do better). Some apps depend on each other (a subscription app needs a specific payment method, a B2B app needs a specific theme integration). We map those before we cut anything.

The script tag inventory we pulled on the homewares store
Below is a redacted version of the inventory we surfaced on day one. The stack is typical for an Australian DTC brand doing seven figures but not yet on Shopify Plus.
App                          Type          Mechanism              First-load JS
-------------------------    ----------    -----------------     -------------
Klaviyo                      Email/SMS     Script tag (sync)     ~150ms
Yotpo Reviews                Reviews       Script tag            ~250ms
Yotpo Loyalty                Loyalty       Script tag            ~180ms
Stamped (legacy)             Reviews       Script tag            ~280ms
Privy                        Pop-ups       Script tag            ~120ms
Sumo Quiz                    Quiz          Script tag            ~140ms
ReConvert Upsell             Upsell        Script tag            ~110ms
Bold Bundles                 Upsell        Script tag            ~130ms
Smile.io                     Rewards       Theme App Extension   ~95ms
Gorgias Chat                 Helpdesk      Script tag            ~190ms
Google Tag Manager           Tracking      Script tag (sync)     ~150ms
Meta Pixel                   Tracking      Script tag (sync)     ~100ms
TikTok Pixel                 Tracking      Script tag            ~85ms
Hotjar                       Heatmaps      Script tag            ~160ms
PageFly                      Page builder  Script tag + theme    ~310ms

That total first-load JavaScript penalty came to roughly 2.45 seconds before the page started rendering. The hero image had a 1.1 megabyte payload because the previous agency had uploaded a single high-resolution file and let the theme handle responsive sizing. The cumulative effect was an LCP of 4.8 seconds, an INP score in the Poor band, and a CLS score that drifted because three of the apps were injecting content above the fold after the first paint.
Apps we removed with zero merchant impact
Removal is the cheapest performance fix on Shopify. Every app you delete removes its JavaScript, its CSS, its admin overhead, and its monthly fee. The constraint is that the team has to agree the merchant capability is replaceable or non-essential.
We removed Stamped first because the team had migrated to Yotpo Reviews eight months earlier but never deactivated the Stamped script. The data had been ported. Stamped was loading on every page for nothing. That single deletion saved 280 milliseconds of first-load JavaScript and $89 AUD a month.
Sumo Quiz had been installed for a Mother’s Day campaign in 2024 and never used since. We deleted it. Privy had been replaced by a Klaviyo on-site sign-up form, but the Privy script was still firing across the site. Deleted. Bold Bundles overlapped almost entirely with ReConvert and the team had stopped using it. Deleted. Hotjar was running heatmaps that nobody had logged into for four months. We exported the historical recordings, deleted the app, and replaced the live heatmap need with a quarterly Microsoft Clarity audit that we run from the agency side at no marginal cost to the brand.
Total apps removed: five. Total monthly savings: $487 AUD. Total first-load JavaScript savings: roughly 740 milliseconds. Nobody on the merchant side noticed the apps were gone.
Apps we replaced with theme app extensions or web pixels
Removal is the easy half. The harder half is replacing apps that the brand actually needs, with versions of the same capability that load in a way the browser does not have to wait for. There are two patterns we lean on.
The first pattern is migrating tracking pixels off Additional Scripts and into the Customer Events API. Sandboxed Web Pixels run in an iframe, off the main thread, and cannot block the page. Once Shopify deprecated the old Additional Scripts box in checkout and pushed everyone to the Customer Events sandbox, checkout speed measurably improved for stores that completed the migration. We moved the Meta Pixel, TikTok Pixel, and Google Tag Manager events into custom pixels listening on the Customer Events bus. The conversion data did not change. The events fired identically. The main thread was no longer blocked by three sync script tags.
The second pattern is replacing legacy ScriptTag apps with Theme App Extensions that use app embed blocks. App embeds load only on the pages where they are needed, and they get removed cleanly when the app is uninstalled. On the homewares store, Yotpo Reviews was upgraded to its Theme App Extension version, which let us scope its loading to product pages and the homepage reviews carousel only. The collection grid and the cart no longer carried 250 milliseconds of reviews JavaScript they did not need.
Klaviyo got the same treatment. The default Klaviyo script loads synchronously in many theme installations, which means the browser waits for the full payload to download and execute before painting. We moved the Klaviyo embed into a defer-loaded app block, and the sign-up form pop-up logic was triggered by a small inline script that only injected the heavy library after the user had completed first interaction. On a 3G mobile connection that 150 millisecond Klaviyo delay had been ballooning to 400 milliseconds. Now it loads after LCP entirely.
Apps we kept but throttled
Some apps are non-negotiable. Gorgias Chat was the customer service spine for the team and removing it was not on the table. PageFly carried the brand’s two highest-converting landing pages and rebuilding them inside the native theme was a multi-week project we scheduled for a later phase.
For Gorgias, we moved the widget to a lazy-loaded pattern. The chat icon shell renders immediately from inline CSS, but the heavy Gorgias library only downloads when the user scrolls past the fold or interacts with the icon. The conversation history, attachments, and agent presence all still work the moment the user clicks the icon. The 190 milliseconds of pre-LCP JavaScript disappears.
For PageFly, we used the page builder only on the two landing pages it genuinely earned. The rest of the site moved back to native sections and section groups, and the PageFly script was scoped out of every template except those two. The 310 milliseconds of page builder weight fell off home, collection, and product templates entirely.
ReConvert stayed because the post-purchase upsell was earning revenue and it only loads in the checkout flow, not the main storefront. We left it untouched. Smile.io stayed because it was already on a Theme App Extension with sensible scoping, and the 95 millisecond loading penalty was a fair trade for a loyalty program that the team actively managed.
The result: LCP from 4.8s to 1.6s and what it earned
The before-and-after looked like this at the 75th percentile of mobile sessions, measured over the 28-day window Shopify’s Web Performance dashboard uses.
Metric              Before        After         Change
-------------       ---------     ---------     ----------------------
Mobile LCP          4.8s          1.6s          -67% (Good band)
Mobile INP          340ms         140ms         -59% (Good band)
Mobile CLS          0.18          0.04          -78% (Good band)
First-load JS       ~2.45s        ~0.6s         -75% script overhead
Apps installed      15            8             -7 apps
App spend (AUD)     $1,180/mo     $640/mo       -$540/mo
Mobile conv. rate   1.6%          2.4%          +50% relative
Monthly revenue     ~$120K AUD    ~$154K AUD    +$34K AUD
The conversion lift compounds the saving. The brand recovered $34,000 AUD a month from a single technical project, plus $540 AUD a month from cancelled app subscriptions, plus a Core Web Vitals score that started feeding back into Google’s ranking signals on category pages that had been quietly declining for three quarters.
The pattern is not exotic. We see the same Largest Contentful Paint improvement on roughly two thirds of the Shopify stores we audit, because the cause is almost always the same: an accumulated stack of apps that no one has reviewed since the brand crossed seven figures. Our companion guide on Core Web Vitals for Shopify in 2026 covers what Google measures and how the thresholds apply. The diagnostic walkthrough on real client stores shows the same audit method applied to a different vertical.
The 5-stage app audit framework we run on every Shopify Plus engagement

The homewares brand was not a one-off. Below is the framework we now run on every new Shopify and Shopify Plus engagement at Insiteful, in the order we run it.
Stage 1: Inventory. Pull the full app list with monthly fee, install date, and merchant owner. Pull the script tag inventory from DevTools with the Network panel set to capture before LCP. Map every script to its app, its loading mechanism, and its main-thread cost in milliseconds.
Stage 2: Field data baseline. Export the Web Performance dashboard for the last 28 days, broken out by template type (home, product, collection, cart). Note the 75th percentile LCP, INP, and CLS for each template. Cross-reference with Google Search Console’s Core Web Vitals report to see which URL groups are flagged as Needs Improvement or Poor in Google’s eyes.
Stage 3: Capability dependency map. Group apps by capability (email, reviews, upsell, loyalty, chat, search, pop-ups, page builder, subscription, B2B). Identify overlaps and orphans. Tag each app as Essential, Replaceable, Redundant, or Unused.
Stage 4: Replacement and removal plan. For every app tagged Redundant or Unused, schedule deletion. For every app tagged Replaceable, identify a Theme App Extension equivalent, a native Shopify feature equivalent (Shopify Functions can replace surprisingly many discount and upsell apps now, and our Shopify Functions guide covers which ones), or a lighter app in the same category. For every app tagged Essential, identify whether it can be migrated to an app embed block, scoped to specific templates, or deferred to load after LCP.
Stage 5: Implement and measure. Execute the changes inside a staging duplicate of the theme. Run Lighthouse against the staging URL and confirm the LCP, INP, and CLS scores have moved in the right direction before pushing live. After publication, wait 28 days and re-pull the Web Performance dashboard to confirm the field data agrees with the lab test. If the field data has not improved, audit what blocked the lift and iterate.
The framework is mechanical on purpose. It removes the temptation to make decisions by reputation (“Klaviyo is fine, leave it alone”) and forces every app to defend its place on the storefront with data.
How We Do It at Insiteful
Insiteful has been building Shopify and Shopify Plus stores for twenty-five years across more than two hundred sites a year. The app audit is one of the first projects we run on any new Plus engagement, alongside a checkout extensibility review and a theme architecture review. We treat the storefront as a revenue machine. Every script that loads on it is either earning the milliseconds it costs, or it gets removed.
The deliverable for a brand is a written audit report, a redacted version of the script tag inventory and the field data baseline, a recommended removal and replacement plan in priority order, and an estimated timeline for the implementation. The implementation itself happens inside the staging environment, gets tested against Lighthouse and the Shopify Web Performance dashboard, and rolls live behind a feature flag where appropriate so the team can roll back if the field data does not behave the way the lab tests predicted.
What we have learned across the audits is that the apps a brand thinks are most important are rarely the ones costing them the most performance. The accumulated detritus, the trial apps no one removed, the duplicate review widget, the legacy script tag the previous agency forgot to clean up. Those are where most of the LCP penalty lives. Removing them is fast, low-risk, and pays back the consulting fee inside the first month of recovered revenue. That is the practical case for the audit, and it is why we run it every time. Our broader stack philosophy lives in the Shopify App Stack we recommend in 2026, which covers the apps we keep installing and the ones we always remove.
Book a build assessment
If your store has been accumulating apps for more than two years and you have not run an audit, you are almost certainly carrying somewhere between 800 milliseconds and 2.5 seconds of avoidable JavaScript. The brands we audit recover that within four to six weeks, and the revenue impact is usually visible inside the first sixty days of field data. Book a build assessment with Insiteful and we will run the inventory, the field data, and the dependency map for your store and tell you what comes out, what gets replaced, and what the projected lift looks like in your numbers.
�����